Christie Dong | IMT 561 Portfolio

Photo of Christie Dong

Christie Dong (she/her)

I am a master’s student in Information Management at the University of Washington, focusing on data analytics and human-centered AI.

This quarter I want to improve my skills in interactive visualization and storytelling with data.

One topic I am excited to visualize is fitness and health data, because I am interested in how data can make everyday experiences like exercise more intuitive and engaging.

Documenting iterative process

Treadmill Calorie Clock — Gym Context

A workout timer for treadmill users. Instead of watching seconds tick, you see food icons around the dial showing what you've burned — peanuts at 5 min, egg at 15, cola at 25, fries at 40, cheeseburger at 55. Press Space to start. Each food lights up when the minute hand reaches it; the right panel tracks how many times you've earned each one.

Final Clock 1

Sketch iteration documentation (paper/hand-drawn photos)

Clock 1 sketch iteration 1
Clock 1 sketch iteration 2

Design process:

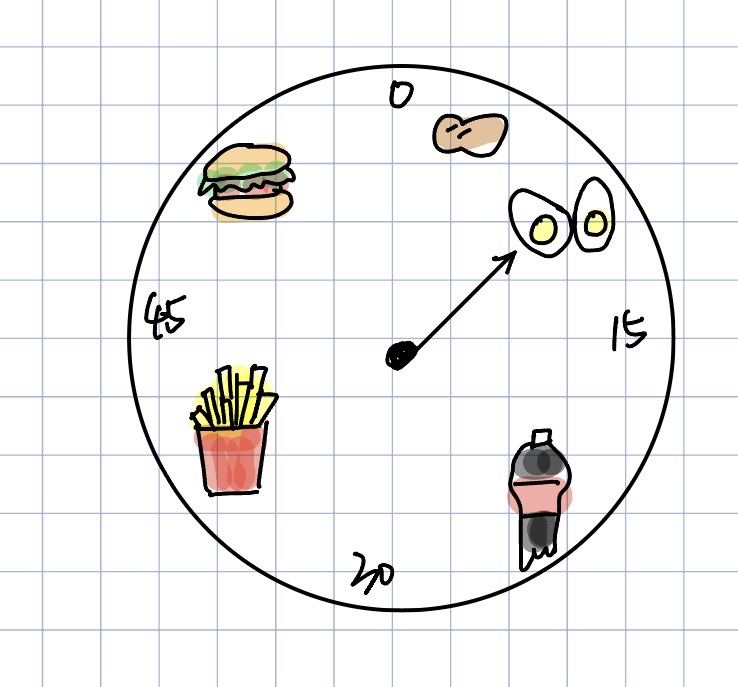
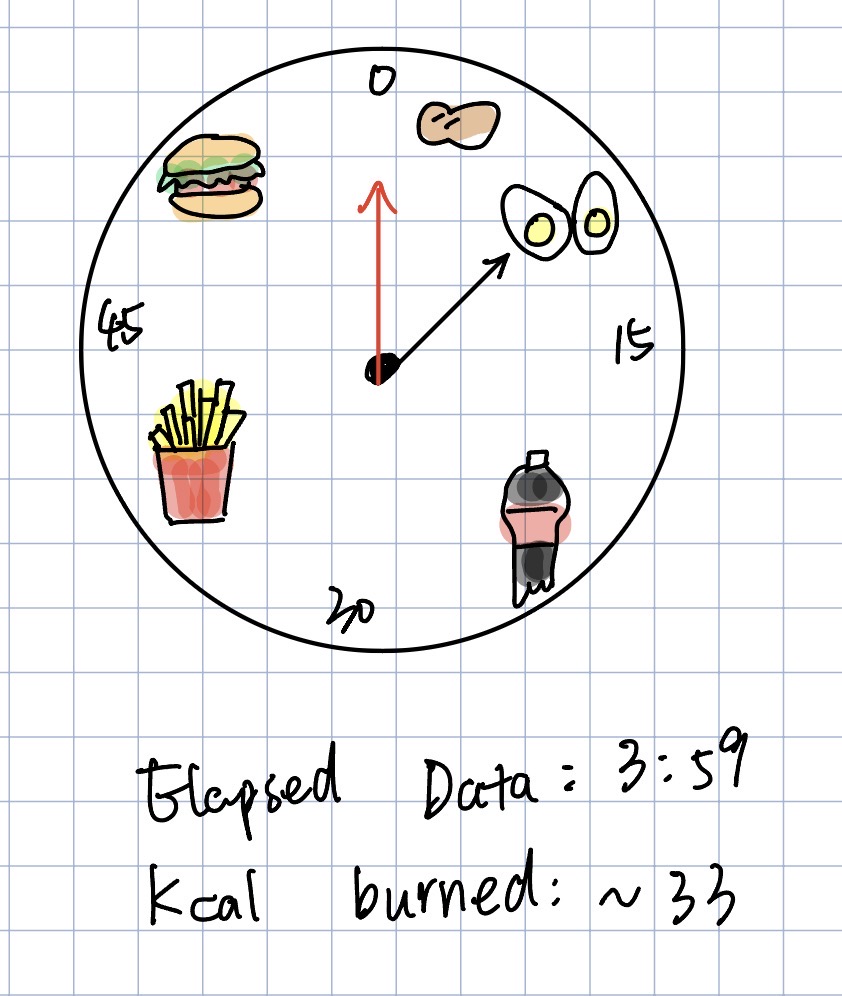
  • Food as time units: Each food is placed at its calorie-equivalent minute (~8 kcal/min). This turns abstract time into a motivational goal — you're running toward a cheeseburger, not just a number.
  • One food at a time: Only the food the hand is currently pointing at shows in full color; the rest are grayed out. This uses pre-attentive processing — the active item pops out instantly with no effort.
  • Three time layers: Minute hand, second hand, and a digital readout all show time at once. Each serves a different need — glancing, rhythm, precision.
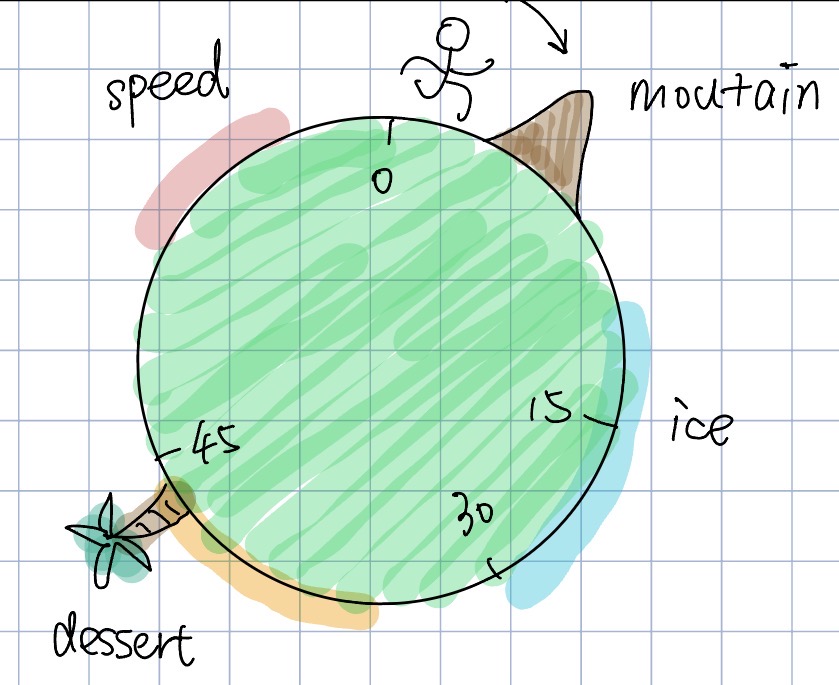
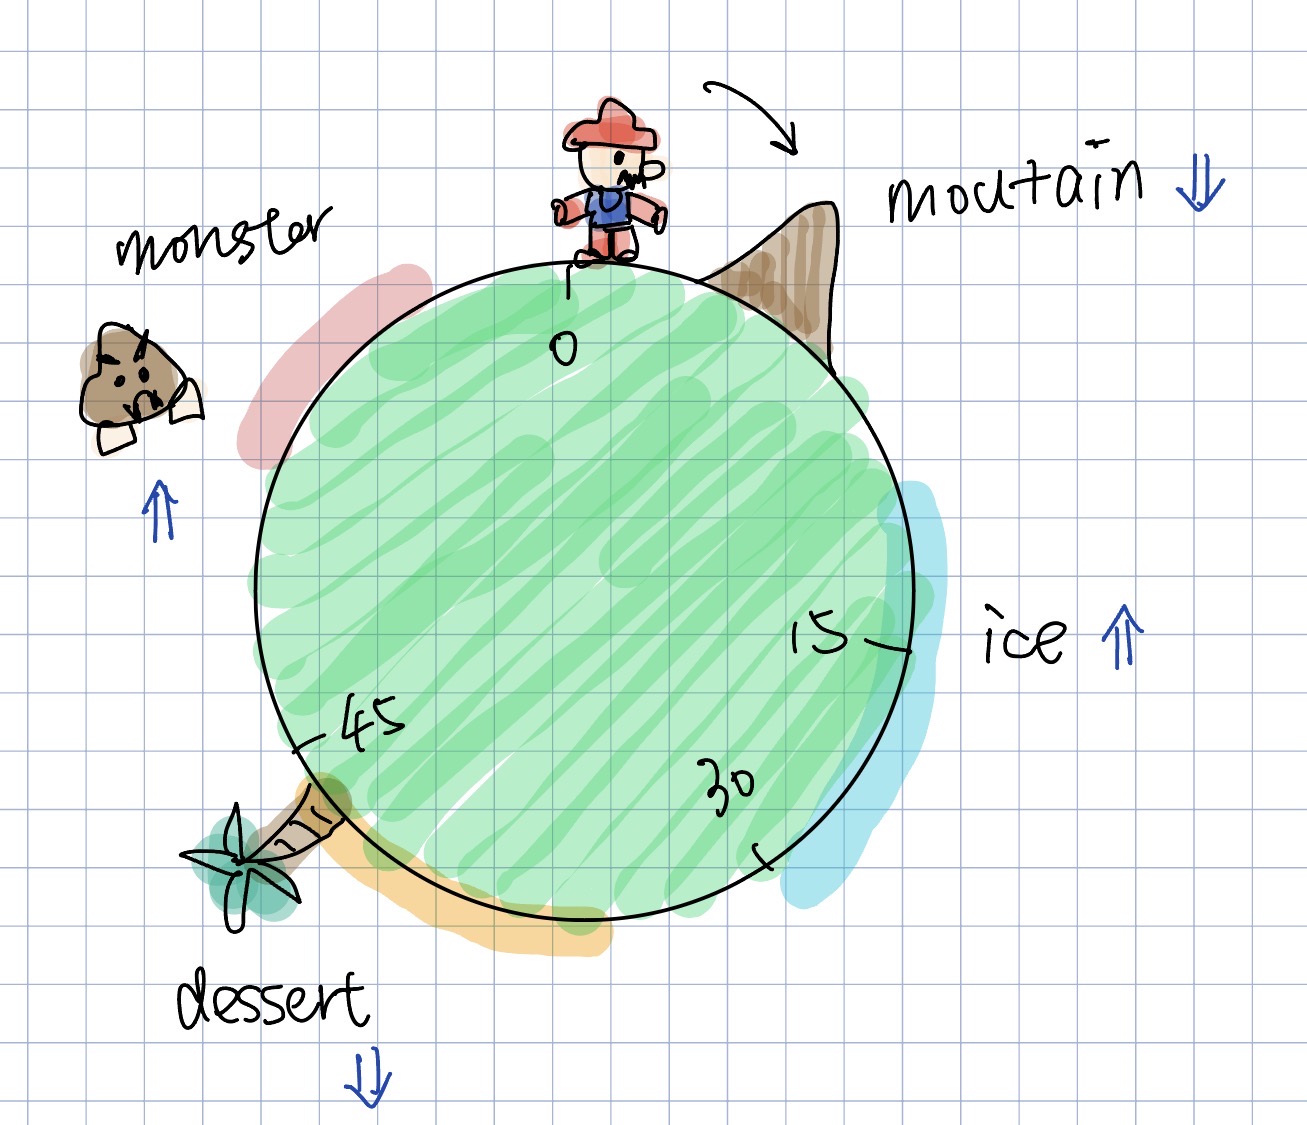
  • Iteration: Early drafts had food icons inside the ring, overlapping the tick marks. Moved them outside, switched to light background, simplified ticks to every 5 minutes.

Self-reflection / future work:

  • The calorie rate (~8 kcal/min) is fixed. Ideally users could enter their weight and speed so food positions adjust to their actual burn rate.
  • The gray effect uses a semi-transparent circle over the emoji — a workaround. Custom SVG icons would give true grayscale and look cleaner across browsers.

Documenting iterative process

Mario Planet Clock — Gym Context

A game-inspired treadmill clock. Mario runs around a planet split into five terrain zones: Plain, Mountain, Ice, Desert, and Monster. Each zone warps the clock ring — slow zones get less arc, fast zones get more — so 30 minutes is never at the halfway point. In the Monster zone, a pixel-art Goomba waits at the entrance and chases Mario once he arrives. Click anywhere to shuffle the terrain order.

Final Clock 2

Sketch iteration documentation (paper/hand-drawn photos)

Clock 2 sketch iteration 1
Clock 2 sketch iteration 2

Design process:

  • Non-linear time: Each zone has a speed multiplier (Mountain 0.5×, Plain 1×, Desert 0.7×, Ice 2×, Monster 3×) that sets both how fast Mario moves and how wide the arc appears. The ring becomes a map of subjective effort — hard zones feel long but look short.
  • Pixel-art characters: Mario and Goomba are hand-coded in p5.js using 12-column pixel grids. Mario's walk speed scales with the terrain multiplier. The Goomba has its own two-frame cycle and only activates inside the Monster zone.
  • Goomba chase: Goomba waits at the Monster zone start, then chases at half Mario's speed when Mario enters. It's capped at the zone boundary so it never follows Mario out — the tension resets every lap.
  • Shuffle interaction: Clicking reshuffles the zone order, showing how the same 60 minutes looks completely different with a different effort layout. Background changed from dark space to a light sky after feedback it felt more gym-appropriate.

Self-reflection / future work:

  • Zone sizes are fixed. A better version would sync with real treadmill speed and incline data to generate terrain from actual workout intensity.
  • Pixel sprites use rect() at 3px/pixel which can look blurry on high-DPI screens. Pre-rendering with createGraphics() would fix this.

more details next week